htmltools::img(src = "img/pico.jpg", class = "picture", width="80%")
htmltools::img(src = "img/pico.jpg", class = "picture", width="80%")
#library(kableExtra)
library(glue)
library(rcartocolor)
library(sf)
library(raster)
library(scales)
library(tidyverse)
library(lubridate)
library(gridExtra)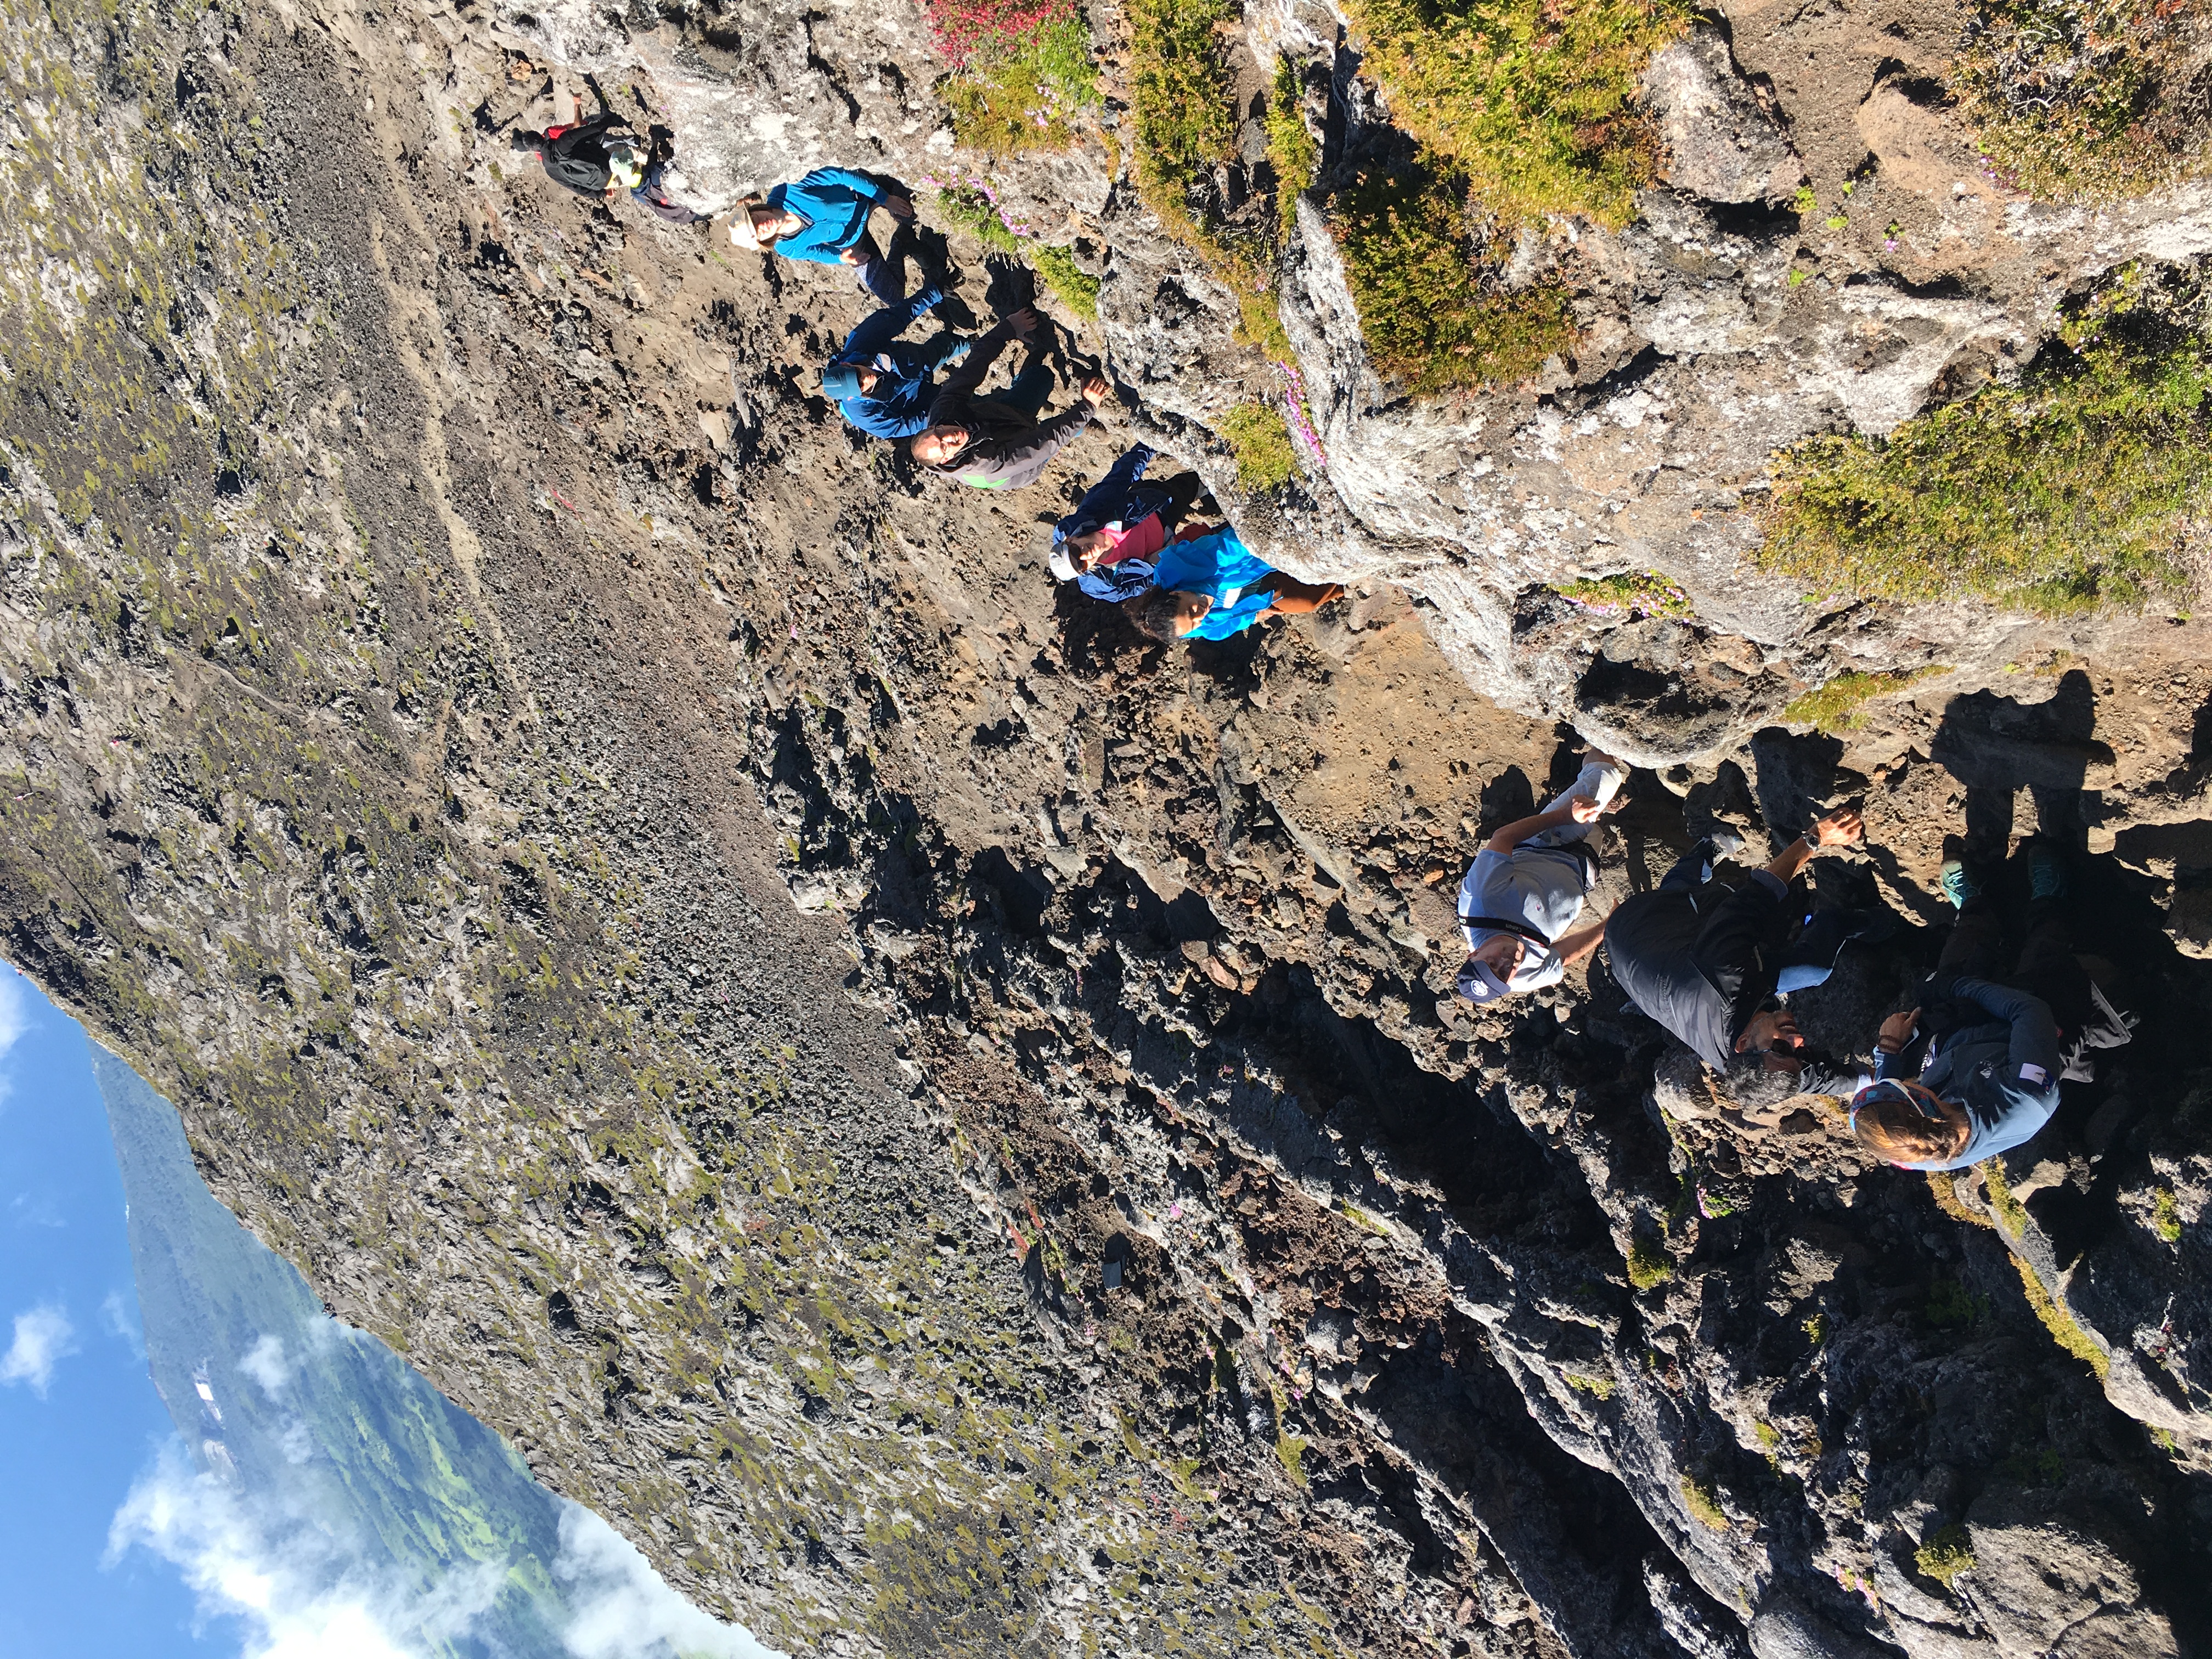
source("theme_az.R")This is a story about the volcanoes of the Azores, the luxuriant volcanic islands in the middle of the Atlantic that belong to Portugal. We don’t hear so much about the Azores so, although I lived half of my life in Portugal, it was only when I was in my mid forties that I first visited them. Fortunately this place remains relatively protected from excessive tourism and environmental damage. These islands also remain an historical exception, by not having been a place for slavery trade or colonialism. They had no indigenous people and were wild and savage when the Portuguese discovered them in the XV century. Throughout the years they’ve remained rather empty and somehow poor but well taken care by long and hard labor. For me they were the place to discover volcanoes as there are many of them and many stories about eruptions, the most notable ones dating back to 1957 and the latest ones to 2001.
Course: EPFL ADSCV
Unit: C02S15U05
author: J.Ramalho
date: 2022-12-31
I’ve started testing styling of Rmd reports since unit 1 of this Communication and Visualization course. In this report I’m thus reusing most of the things I had already learned and also introducing some new:
YAML configuration:
r setup and knitr options:
Rmarkdown features:
<code>`This report uses several data sources other than the internet, namely the book Historia Natural dos Açores (António Neves Trota 2013) and has been prepared using the excellent R Markdown package developed by the R Studio team (Allaire et al. 2020).
Finally in this specific report I’m trying with a dark background for the first time and I’m also removing the title, author and date from the usual position at the page top as this is not intented to be a technical report but rather a brochure type of reading. As usual any feedback on format or content is more than welcome.
Between latitudes N36°55’ and N39°43’ and longitudes W24°46’ and W31°16’ lay the Azores archipel. The islands correspond to the emerged parts of oceanic volcanic mountains chains whose average depth is around 2km and stand right where three litospheric plates join. The plates are moving to a point that the western islands distance to the others increase by approximately 23 mm/year. Below we’re showing a map of the archipel created with shapefiles issued by the Portuguese government Distritos de Portugal and mapcruizin.
ggplot() +
  # using the government borders shapefil for the islands
  geom_sf(data = az_borders, fill = "darkgreen") +
  # using the island names, from the main places shapefile for the labels:
  geom_sf_text(data = az_islands, aes(label = island), size = 3, color = "black",
               check_overlap = TRUE, nudge_x = -0.5, nudge_y = 0.25
  ) +
  coord_sf(xlim = c(-32.5, -24), ylim = c(36.5, 40)) +
  theme_az() +
  # theme_void() +
  theme(
    plot.margin = margin(t=1, r=1, b=1, l=0, "cm"),
  #   plot.background = element_rect(fill = "#ccffff")
  ) +
  labs(title = "Azores Islands",
       subtitle = "A Portuguese Archipel in the middle of the Atlantic Ocean",
       x = "longitude",
       y = "latitude",
       caption = "Source: dados.gov.pt / mapcruzin.com")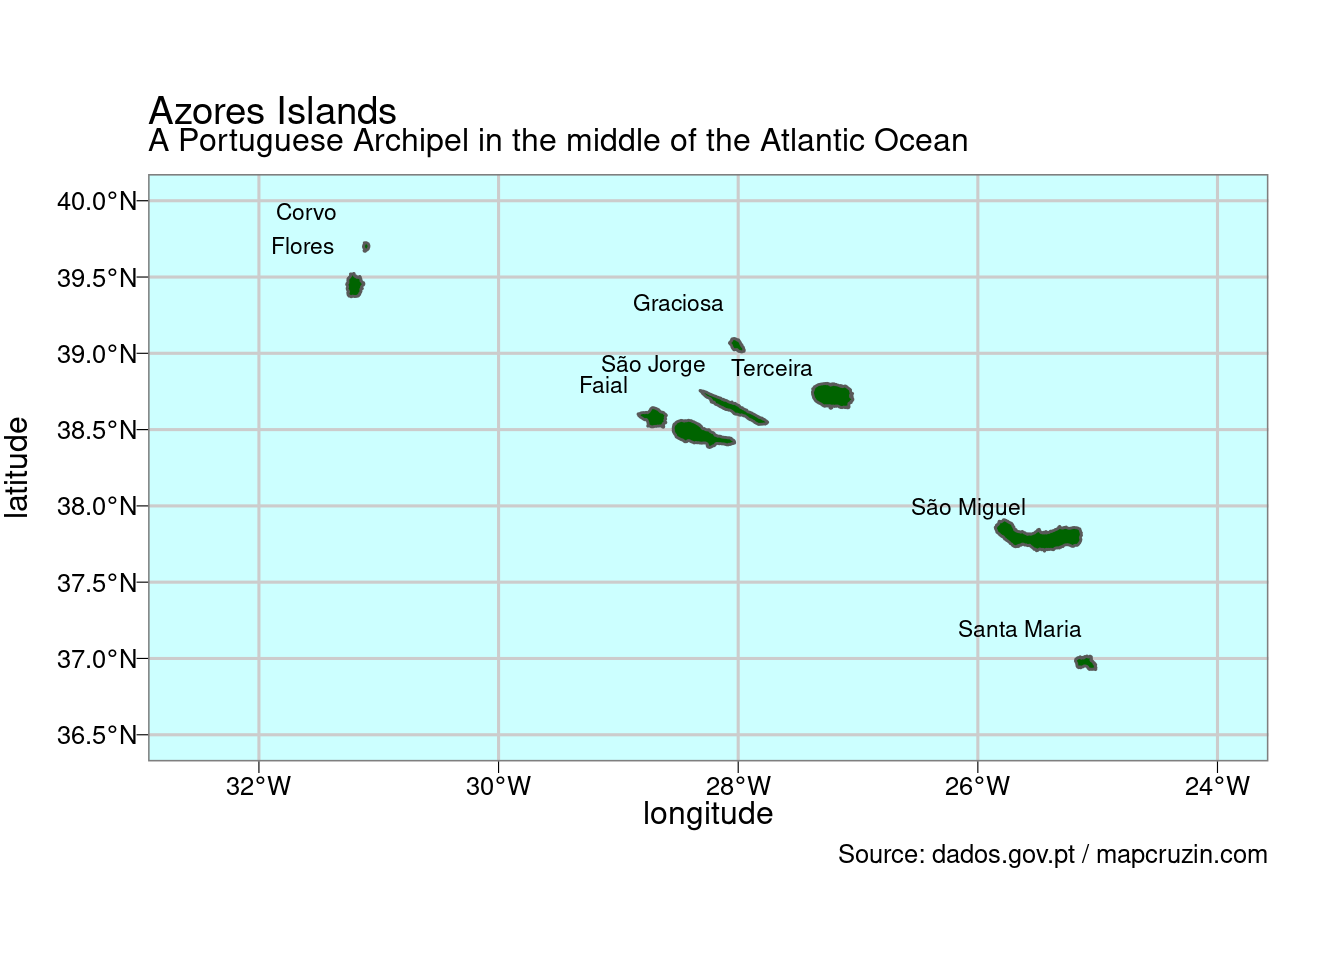
Data on worldwide volcanoes activity can be retrieved from the R Tidytuesday edition on volcanoes: Tidytuesday. Below we’re presenting a small table with an extract of the strongest eruptions of the last 5 centuries, obtained from that this data source:
eruptions <- readr::read_csv('https://raw.githubusercontent.com/rfordatascience/tidytuesday/master/data/2020/2020-05-12/eruptions.csv')
eruptions_az <- eruptions %>%
  filter(longitude >= -31.36 & longitude <= -24.4) %>%
  filter(latitude <= 39.75 & latitude >= 36.5)
eruptions_az_recent <- eruptions_az %>%
  filter(start_year >= 1432)
eruptions_az_top <- eruptions_az %>%
filter(start_year >= 1432) %>%
group_by(volcano_name) %>%
arrange(desc(vei)) %>%
slice(1)
eruptions_az_top %>%
select(volcano_name, vei) %>%
arrange(desc(vei)) %>%
kableExtra::kable() %>%
kableExtra::kable_styling(bootstrap_options = "bordered")| volcano_name | vei |
|---|---|
| Agua de Pau | 5 |
| Furnas | 5 |
| Sete Cidades | 4 |
| Don Joao de Castro Bank | 3 |
| San Jorge | 3 |
| Terceira | 3 |
| Fayal | 2 |
| Pico | 2 |
| Picos Volcanic System | 2 |
| Monaco Bank | 1 |
Running some simple calculations on the original we’ve made a first assessment of the seismic activity of the region: the whole area exhibits important sysmic activity with 33 eruptions registered since the discovery of the islands in 1432, an average of 5.6 per century. For comparison Nature researchers detected 238 eruptions worldwide since 2’500 years which comes to 9.5 per century (Sigl 2015).
Here we’re going further and we’re overlapping the in our map the location of these strongest volcanoes of the last five centuries:
ggplot() +
  # using the government borders shapefil for the islands
  geom_sf(data = az_borders, fill = "#66ffcc") +
  # using the island names, from the main places shapefile for the labels:
  # geom_sf_text(data = az_islands, aes(label = island), size = 3,
  #              check_overlap = TRUE,
  #              nudge_x = -0.5, nudge_y = 0.2
  # ) +
  geom_point(data = eruptions_az_top,
          aes(x = longitude, y = latitude, color = as_factor(vei))) +
  coord_sf(xlim = c(-31.2, -24.9), ylim = c(36.9, 39.7)) +
  scale_color_carto_d(palette = "RedOr", name = "VEI") +
  theme_az() +
  labs(title = "Azores Islands",
       subtitle = "Location of the strongest volcanoes",
       x = "longitude",
       y = "latitude",
       caption = "VEI: Volcanic Explosivity Index\n Source: R tidytuesday")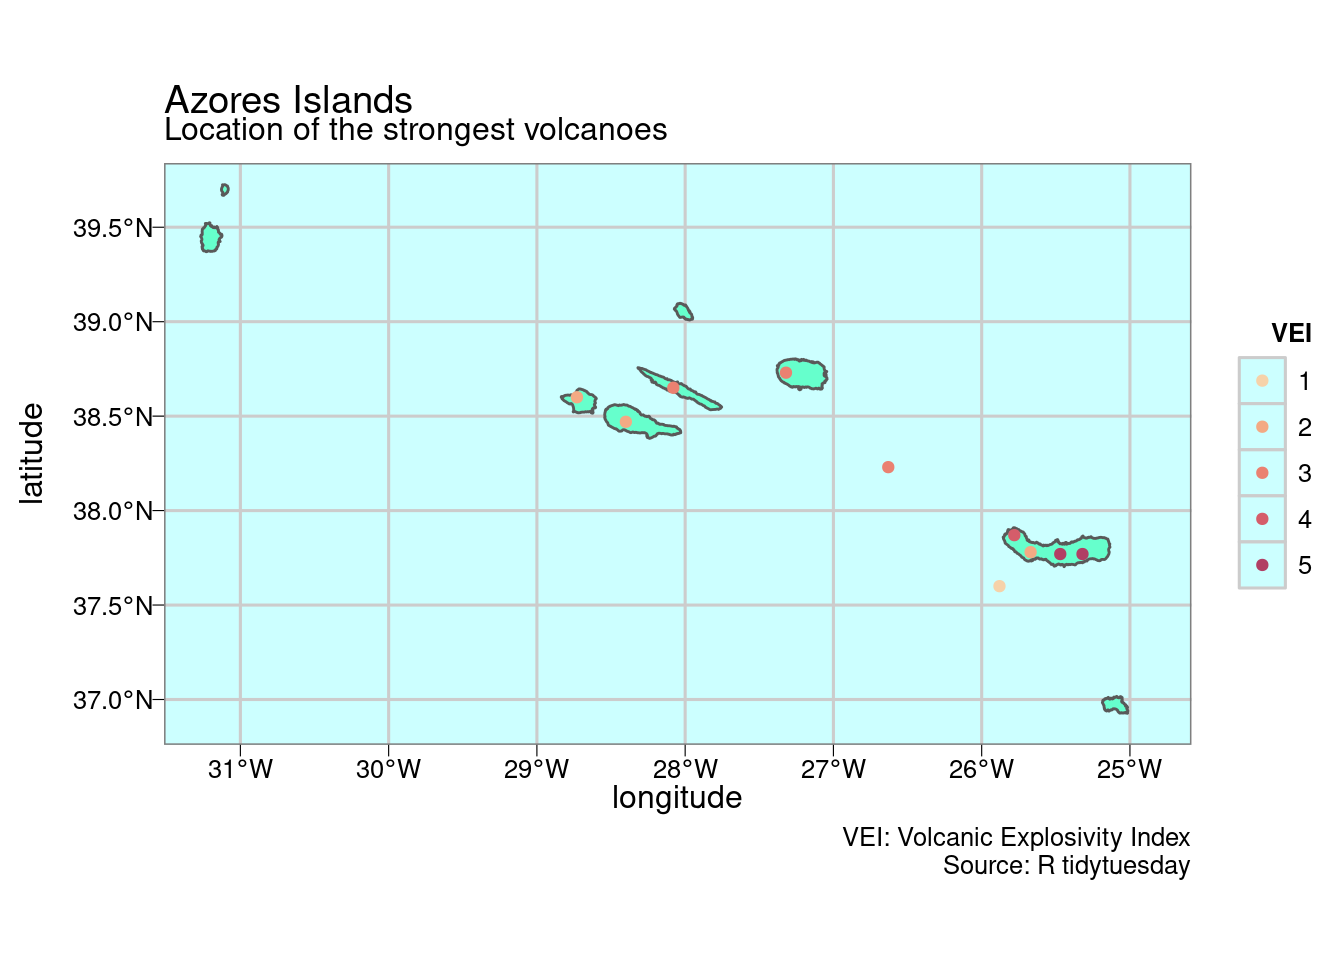
We can see that 4 volcanoes are located on the São Miguel island. Having been there in 2018 I can confirm the current activity: there are many, many hot-springs to be seen. These are big holes of a few meters diameter on the ground with boiling water inside and a very strong smell of sulfur. A highlight of the region is to eat a special plate made of meat, potatoes and cabbage cooked in a pan inserted in one of these holes for a few hours!
A question one often asks is: how long is a volcanoe active. Naturally like any natural phenomenon there’s a wide range of variation. To try to answer this question at least for the scope of our report, we’ve filtered down the events for which there is record of start and end date and present them in the chart below.
eruption_az_time <- eruptions_az %>%
  filter(!is.na(end_day)) %>%
  mutate(start_date = glue('{start_year}-{start_month}-{start_day}'),
         end_date = glue('{end_year}-{end_month}-{end_day}')) %>%
  mutate(end_date = ymd(end_date)) %>%
  filter(!is.na(end_date)) %>%
  select(volcano_name, eruption_number, start_year, vei, start_date, end_date) %>%
  mutate(eruption_interval = interval(start = start_date, end = end_date)) %>%
  mutate(eruption_duration = eruption_interval / months(x = 1)) %>%
  mutate(eruption_duration = round(eruption_duration, 0))

eruption_az_time %>%
  ggplot(aes(x = start_year, y = eruption_duration, fill = as.factor(vei))) +
  geom_col(width = 8) +
  scale_x_continuous(breaks = seq(1500, 2020, 25)) +
  scale_fill_carto_d(palette = "RedOr", name = "VEI") +
  theme_az() +
  theme(axis.text.x = element_text(angle = 45)) +
  labs(title = "Azores volcanoes",
       subtitle = "Activity duration by eruption",
       x = "year",
       y = "Duration [months]",
       caption = "Data Source: R tidytuesday")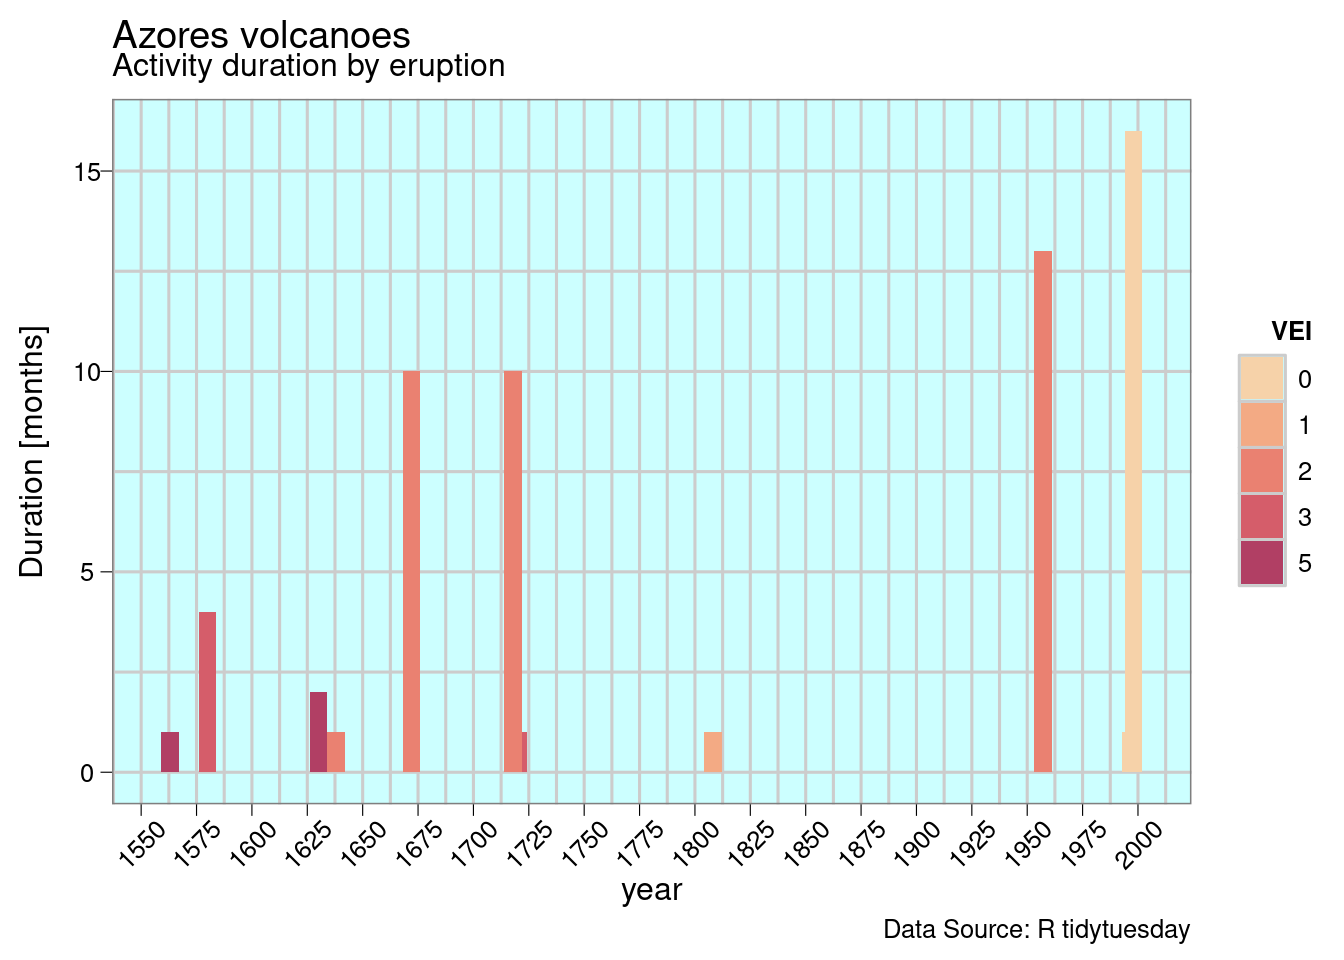
We won’t recommend to draw direct conclusions but at least to observe that low intensity eruptions considered part of the same event have been observed recently lasting more than a year while very strong intensity events lasting a few months. To be noted the famous event of 1957 in Faial lasting more than a year of which we can still the ashes covering part of the island and that triggered so much emigration to the US in the following years due to the agricultural and economic consequences.
Through history volcanoe eruption has not only been a tourist attraction though. Looking at the chart below one can image that first inhabitants have been caught by surprise with devastating effects. The highest tall ever has been the eruption of October 22, 1522 in the São Miguel island, the second to be discovered, with around 5’000 dead. Since then we see the numbers going down but as recently as 1998 there have still been 8 dead and more than a 100 injured in the Faial eruption, the last one happening inland.
casualities <- tribble(
  ~year, ~island, ~deaths, ~injuries,
  1522, "São Miguel", 5000, NA,
  1614, "Terceira", 200, NA,
  1757, "São Jorge", 1000, NA,
  1852, "São Jorge", 9, NA,
  1926, "Faial", 20, 200,
  1935, "São Miguel", 1, NA,
  1980, "Terceira", 59, 400,
  1988, "Faial", 8, 100,
)
casualities_long <- casualities %>%
  pivot_longer(names_to = "type", cols = c("deaths", "injuries")) %>%
  mutate(type = fct_rev(type))
palette <- c("#cc66ff", "#0033cc")

casualities_long %>%
  ggplot() +
  geom_col(aes(x = year, y = value, fill = type), width = 8) +
  scale_fill_manual(values = palette) +
  scale_y_continuous(labels = label_number(big.mark = "'")) +
  theme_az() +
  labs(title = "Azores volcanoes",
       subtitle = "Deaths and Injuries throught the history",
       y = "Victims",
       caption = "Data Source: Historia Natural dos Açores (Trota,2013)")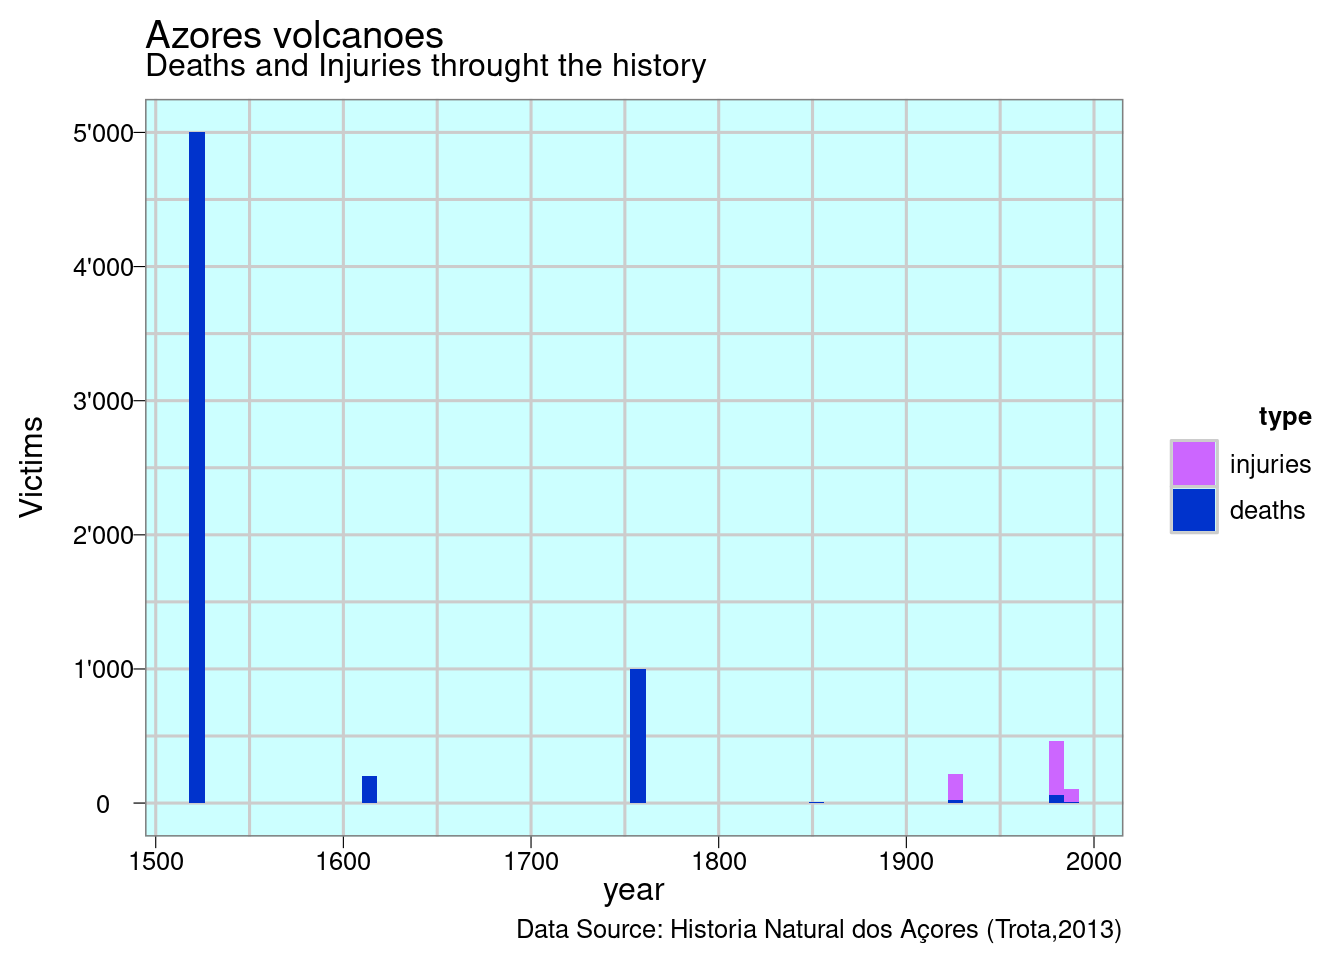
Scaring, intriguing and beautiful, these are the volcanoes.I end this report as I started: with a photo of the Pico volcano. This time with me climbing the mountain, much like climbing the steep but rewarding mountain of the Applied Data Science course of the EPFL extended school!
# include_graphics("img/philippines_donors.jpg")
htmltools::img(src = "img/joao_climbing.JPG", class = "picture", width="50%")